Workforce Intelligence
Partially live — in active developmentTurn workforce data into a clearer view of capacity, capability and change.
Understand workforce supply, demand and capability patterns
Workforce Analytics helps organizations examine the composition and movement of their workforce using appropriately governed data. It can support questions about role distribution, skills coverage, hiring patterns, learning participation, mobility and workforce supply-demand alignment. Analytics should clarify the population, definitions and time period behind each view, and protect individuals from inappropriate disclosure.
Explore workforce patterns through consistent metrics, governed access and clear analytical context.
Population-scale registries and trend content are live; organization dashboards are in active development.
In depth

A shared analytical language
Reliable workforce analysis starts with consistent definitions for headcount, roles, skills, vacancies, attrition, mobility, learning and capacity. DISHA should make metric definitions discoverable and preserve source lineage, refresh date, filters and calculation rules. Different source systems may define the same term differently; those differences should be surfaced.
Supply and demand visibility
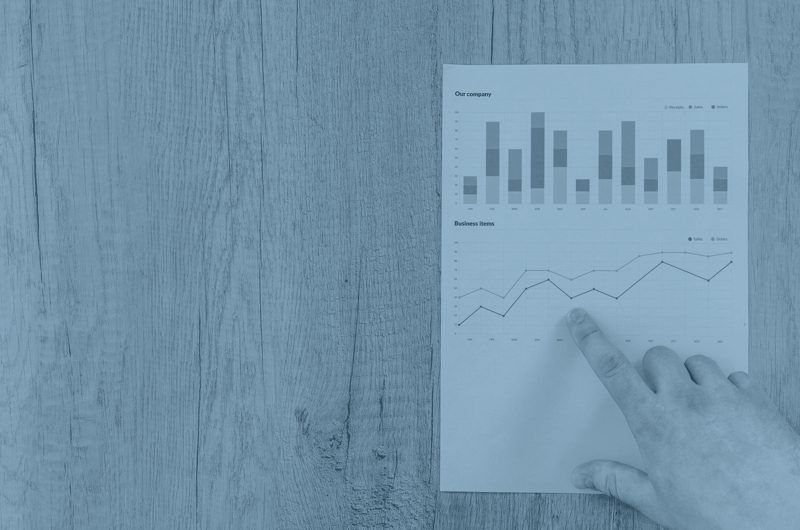
Organizations can compare current workforce capacity and skills with anticipated requirements. Views may include role families, skill clusters, location, seniority and time horizon. Where external labor-market data is included, clearly label its source, population and date so it is not confused with internal employee records.

Patterns and segmentation
Authorized users may explore trends across functions, business units, regions or cohorts. Apply aggregation thresholds and access controls to reduce re-identification risk. Avoid exposing individual-level details in dashboards designed for broad organizational audiences.
From insight to inquiry
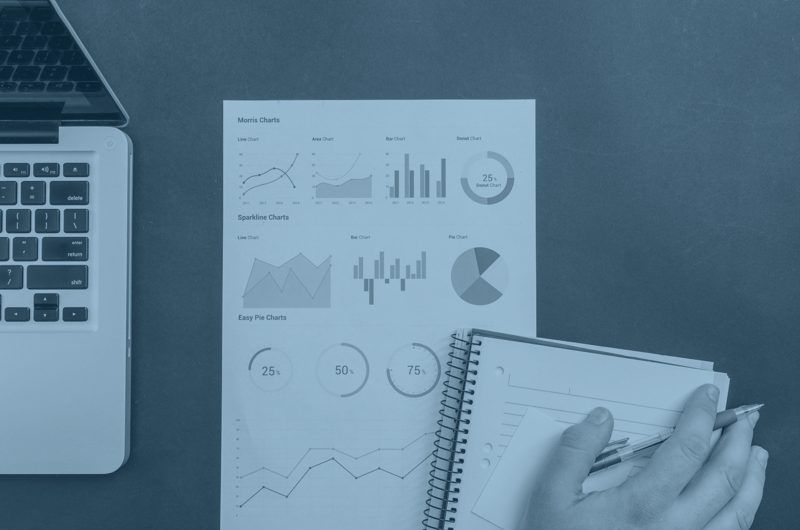
Analytics should support follow-up questions: where is coverage changing, which capabilities are concentrated, where are vacancies persisting, and what learning or hiring responses are being considered? The platform should not automatically convert a statistical association into a causal explanation.

Governance and data quality
Track completeness, duplicate records, taxonomy mapping, freshness and population coverage. Display data-quality warnings and allow authorized analysts to inspect definitions. Record access and exports, and ensure the user’s role limits what they can see.
How it works
Capability domains
Frequently asked questions
Can managers see individual employee data?
Only where their role, purpose and applicable policy authorize it. Broad analytics should use appropriate aggregation and disclosure controls.
Are trends causal explanations?
Usually not by themselves. Observed associations should be separated from hypotheses about causes.
Workforce Intelligence
Experience it inside the live platform.
Open the module that carries this capability, or talk it through with the team.